TABLE OF CONTENTS
Student Stage Dashboard
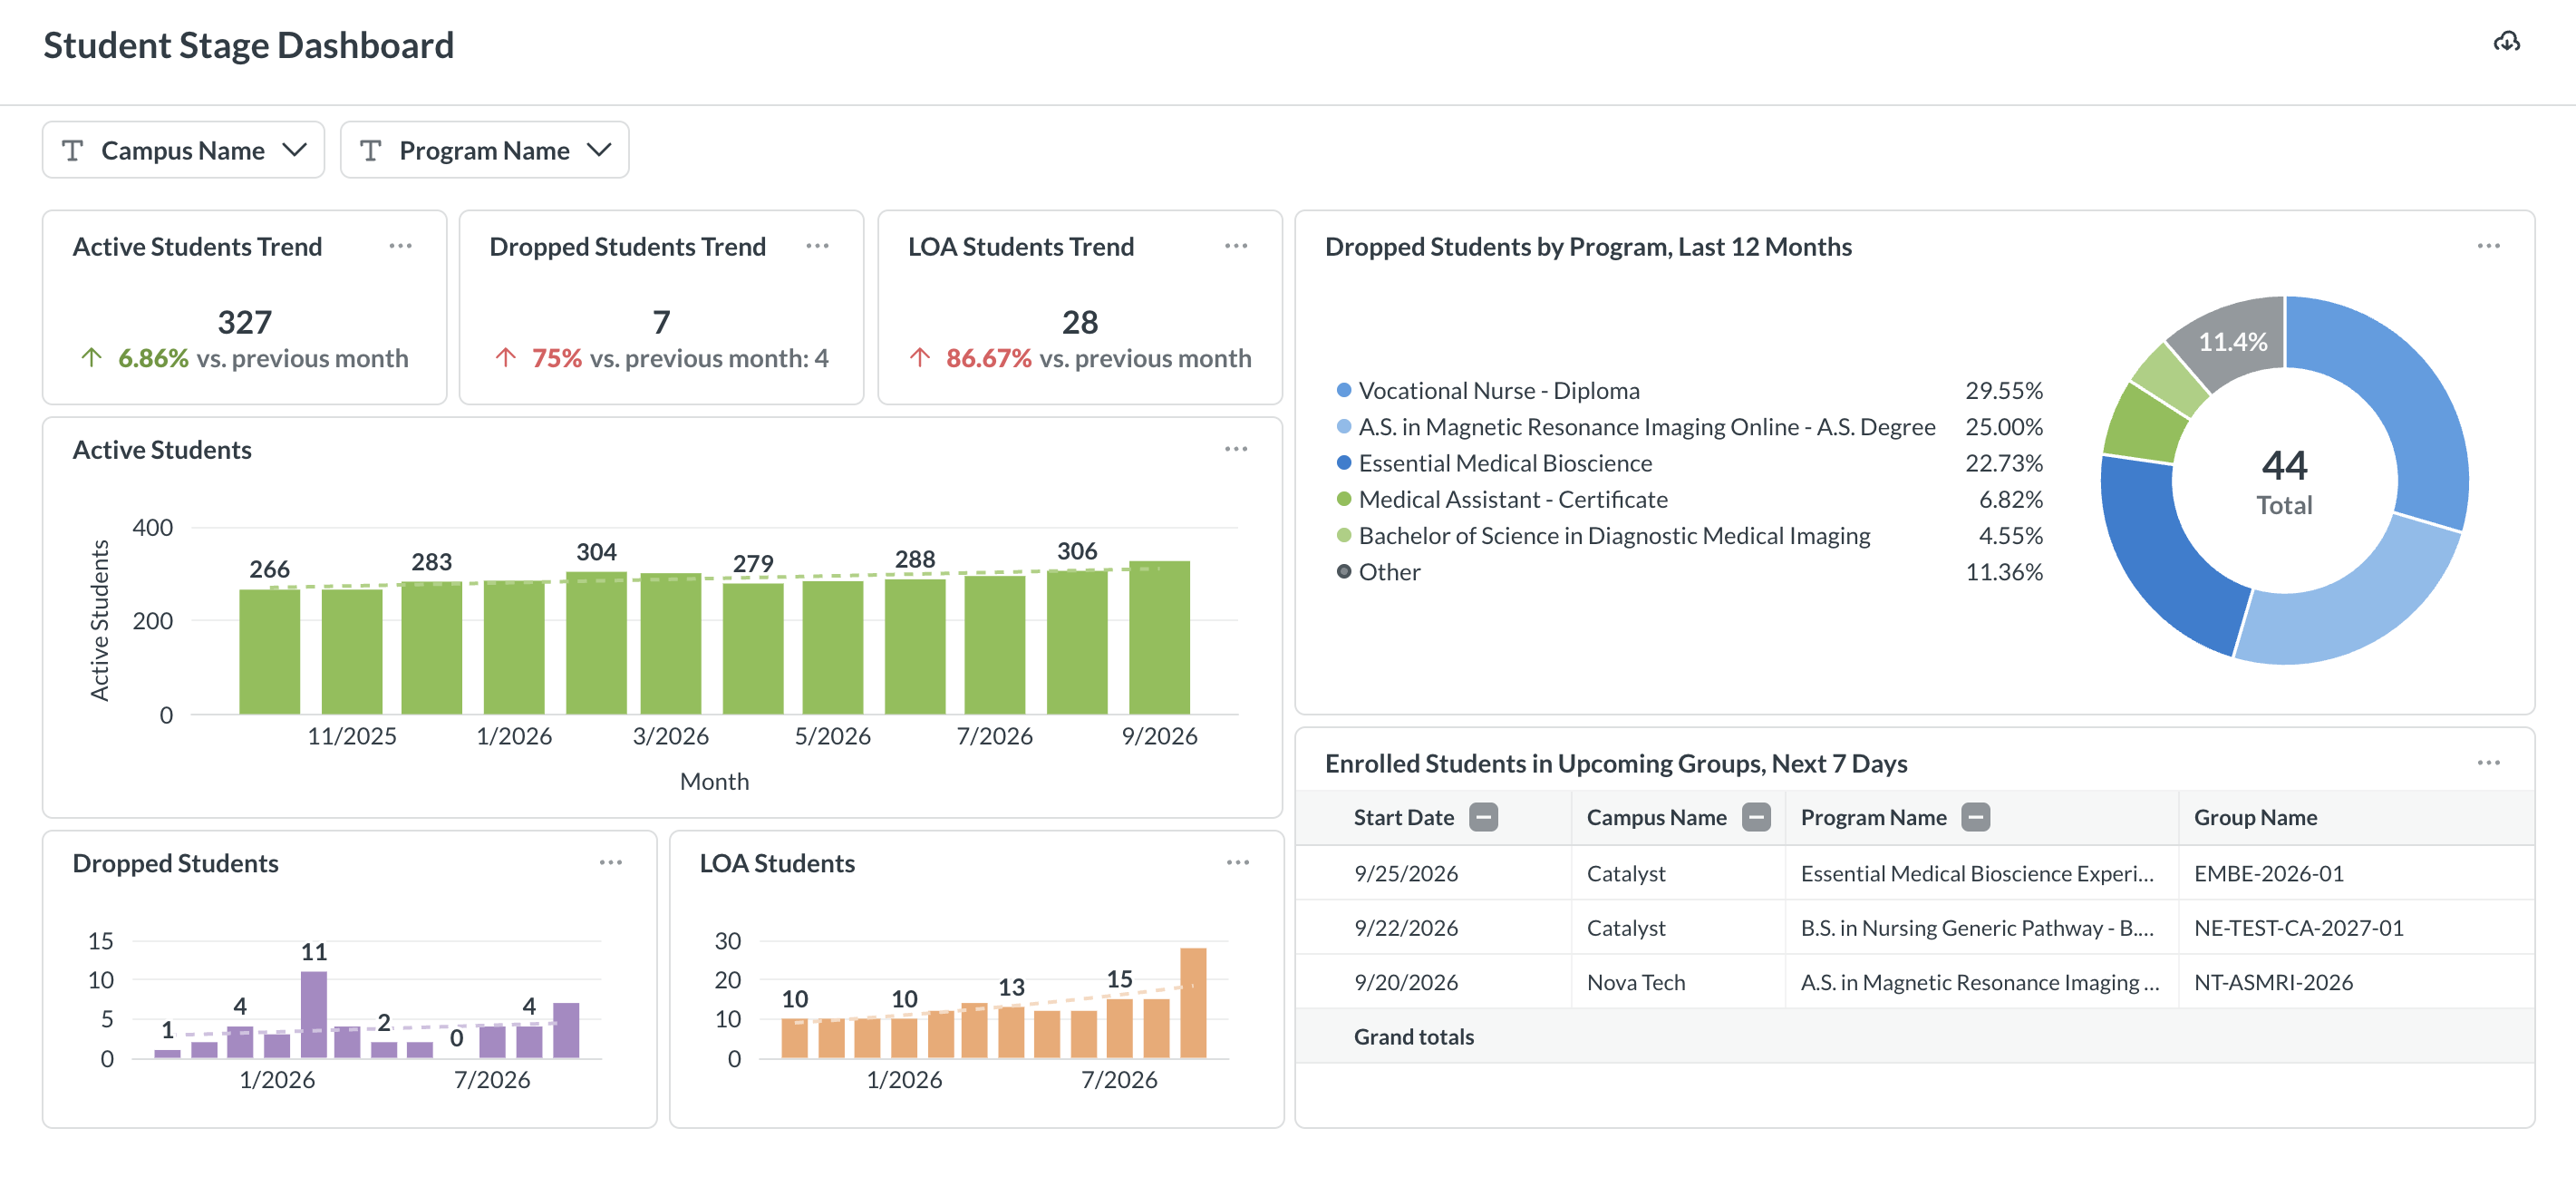
The Student Stage Dashboard is available in the Dashboards menu. The dashboard is implemented in the GEGI Reporting System:
To access the dashboard, users must have the View "Student Stage Dashboard" and View reports in reporting system in guest mode permissions.
The dashboard provides a quick overview of key student stage metrics across programs and campuses. It includes a KPI row with trend cards, bar charts for each metric, and additional charts for dropped students and upcoming group starts.
The top part of the dashboard has filters for selecting data by Campus Name and Program Name. When one or more values are selected, all KPI cards and charts are recalculated for the selected criteria only.
KPI Cards
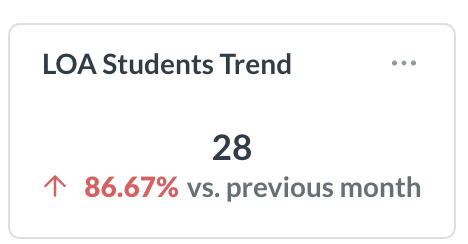
The dashboard includes the following trend cards, each showing the current count and trend compared with the previous month:
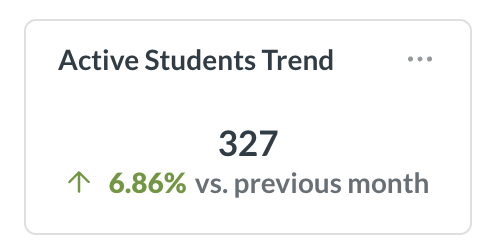
- Active Students Trend — the number of students in the following stages: ENROLLED, ENROLLED Late Start, ACTIVE Pending, ACTIVE, ACTIVE Remediation, ACTIVE Disciplinary Probation, ACTIVE Academic Probation, ACTIVE Warning:
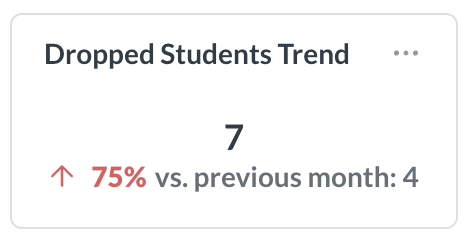
- Dropped Students Trend — the number of students whose stage changed to DROPPED within the current calendar month:
- LOA Students Trend — the number of students in the LOA or LOA Pending stage:
Charts
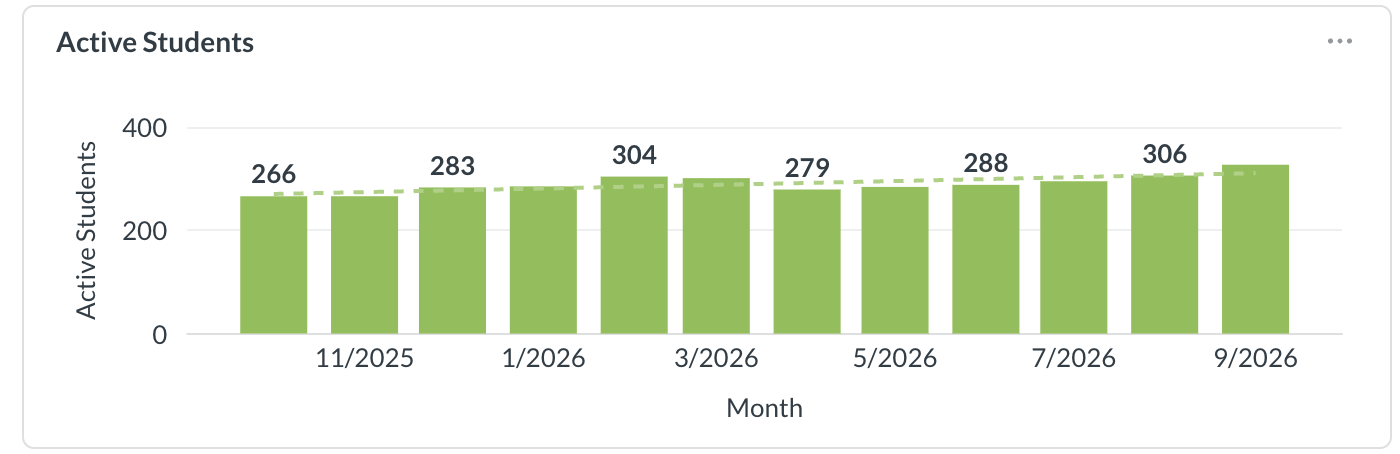
- Active Students — a bar chart showing the number of active students by month:
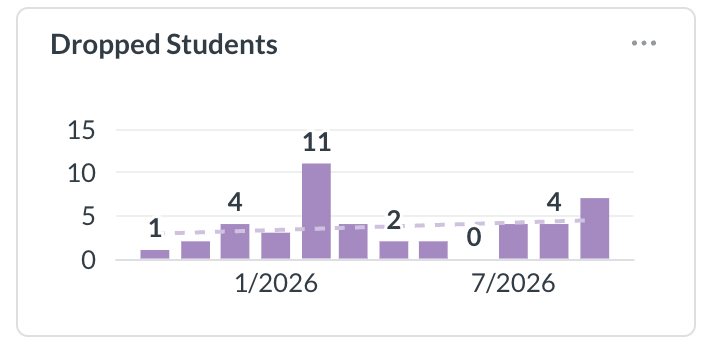
- Dropped Students — a bar chart showing the number of dropped students by month:
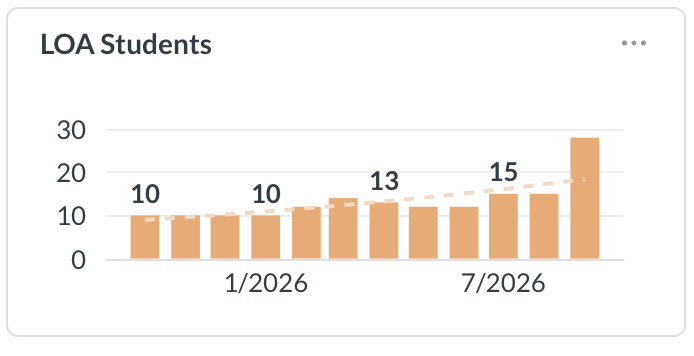
- LOA Students — a bar chart showing the number of LOA students by month:
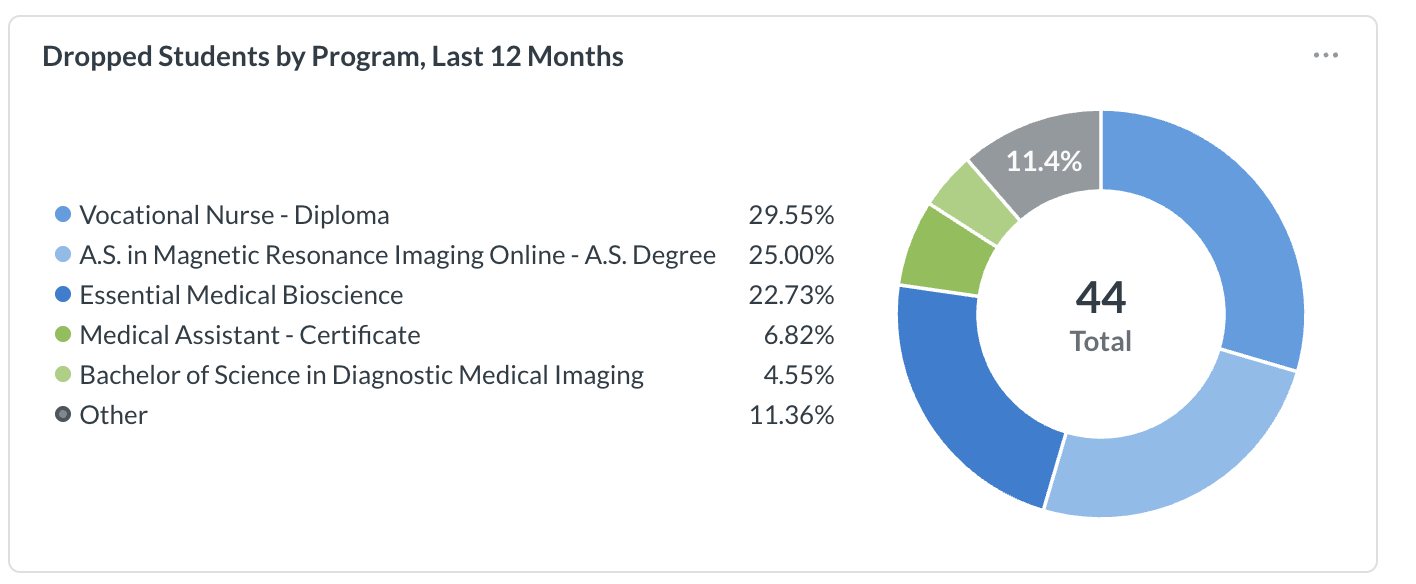
- Dropped Students by Program, Last 12 Months — a pie chart showing the count and percentage of dropped students broken down by program:
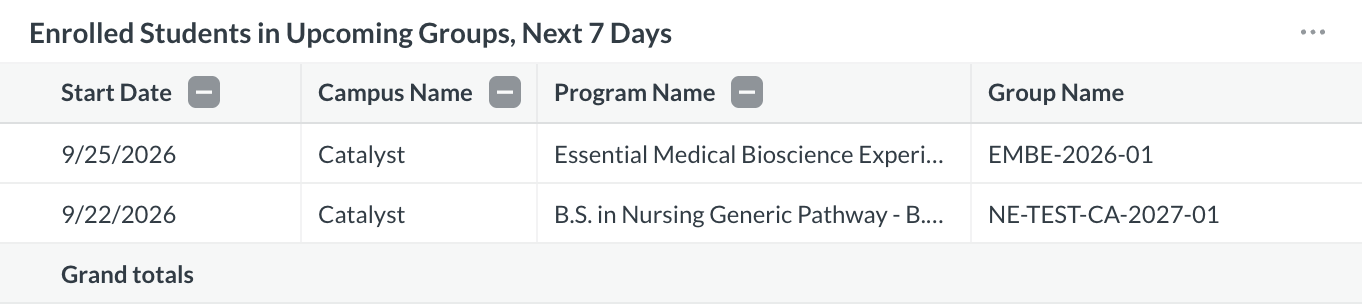
- Enrolled Students in Upcoming Groups, Next 7 Days — a list of groups starting within the next 7 days, showing the start date, campus name, program name, and group name: